Deal of The Day! Hurry Up, Grab the Special Discount - Save 25% - Ends In 00:00:00 Coupon code: SAVE25
Tableau Exam Desktop-Specialist Topic 11 Question 58 Discussion
Actual exam question for
Tableau's
Desktop-Specialist exam
Question #: 58
Topic #: 11
[All Desktop-Specialist Questions]
Topic #: 11
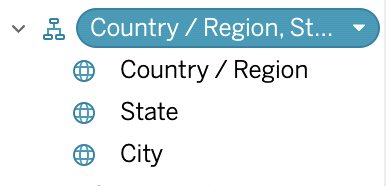
What term is used to describe the following picture?

Suggested Answer:
C
When you connect to a data source, Tableau automatically separates date fields into hierarchies so you can easily break down the viz. You can also create your own custom hierarchies. For example, if you have a set of fields named Region, State, and County, you can create a hierarchy from these fields so that you can quickly drill down between levels in the viz.
https://help.tableau.com/current/pro/desktop/en-us/qs_hierarchies.htm
Currently there are no comments in this discussion, be the first to comment!