Deal of The Day! Hurry Up, Grab the Special Discount - Save 25% - Ends In 00:00:00 Coupon code: SAVE25
Free Preparation Discussions
SAP Exam C_HANAIMP_16 Topic 7 Question 5 Discussion
Actual exam question for
SAP's
C_HANAIMP_16 exam
Question #: 5
Topic #: 7
[All C_HANAIMP_16 Questions]
Topic #: 7
A calculation view consumes the data sources shown in the graphic. You want to identify which companies sold products in January 2018 AND Februa ry 2018.
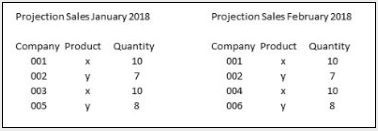
What is the optimal way to do this?
Suggested Answer:
B
Currently there are no comments in this discussion, be the first to comment!