Free Preparation Discussions
Free Microsoft DP-100 Exam Dumps - Page 7
MultipleChoice
You create an Azure Machine Learning compute resource to train models. The compute resource is configured as follows:
* Minimum nodes: 2
* Maximum nodes: 4
You must decrease the minimum number of nodes and increase the maximum number of nodes to the following values:
* Minimum nodes: 0
* Maximum nodes: 8
You need to reconfigure the compute resource.
OptionsHotspot
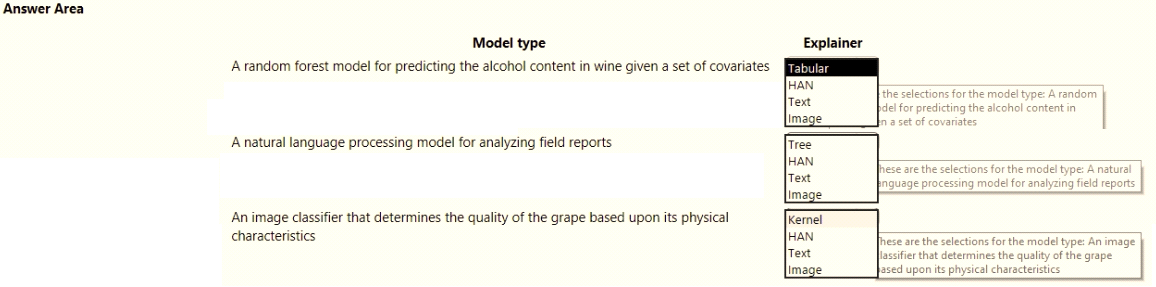
You are hired as a data scientist at a winery. Trie previous data scientist used Azure Machine Learning. You need to review the models and explain how each model makes decisions.
Which explainer modules should you use? To answer, select the appropriate options in the answer area. NOTE: Each correct selection is worth one point.
Hotspot
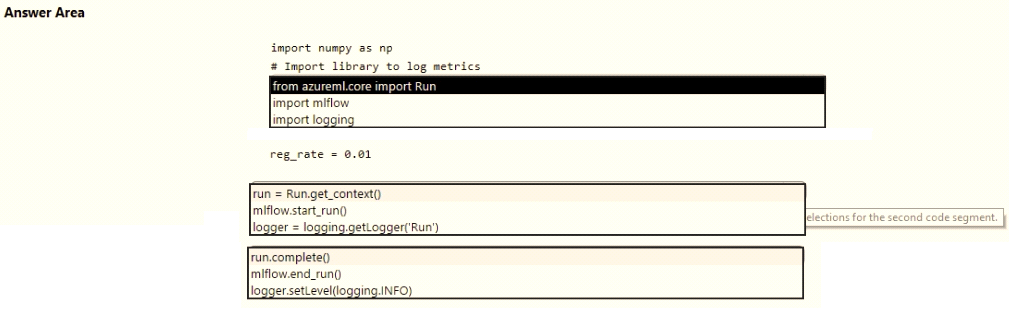
You are running a training experiment on remote compute in Azure Machine Learning.
The experiment is configured to use a conda environment that includes the mlflow and azureml-contrib-run packages.
You must use MLflow as the logging package for tracking metrics generated in the experiment
You need to complete the script for the experiment
How should you complete the code? To answer, select the appropriate options in the answer area.
DragDrop
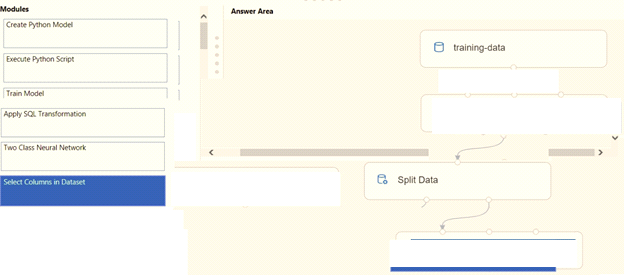
You create a training pipeline using the Azure Machine Learning designer. You upload a CSV file that contains the data from which you want to train your model. You need to use the designer to create a pipeline that includes steps to perform the following tasks:
* Select the training features using the pandas filter method.
* Train a model based on the naive.bayes.GaussianNB algorithm.
* Return only the Scored Labels column by using the query select [scored Labels] froh t1;
Which modules should you use? To answer, drag the appropriate modules to the appropriate locations. Each module name may be used once, more than once, or not at all. You may need to drag the split bar between panes or scroll to view content


Hotspot
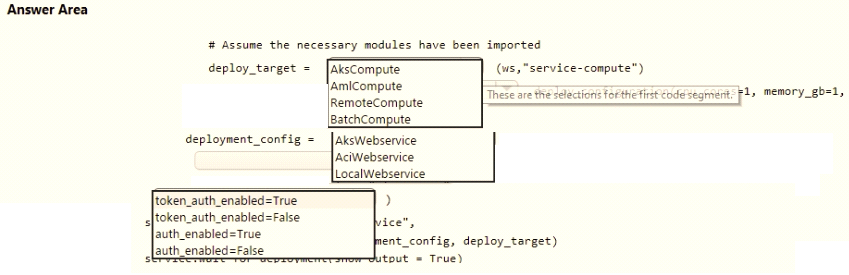
You use Azure Machine Learning to train and register a model.
You must deploy the model into production as a real-time web service to an inference cluster named service-compute that the IT department has created in the Azure Machine Learning workspace.
Client applications consuming the deployed web service must be authenticated based on their Azure Active Directory service principal.
You need to write a script that uses the Azure Machine Learning SDK to deploy the model. The necessary modules have been imported.
How should you complete the code? To answer, select the appropriate options in the answer area.
MultipleChoice
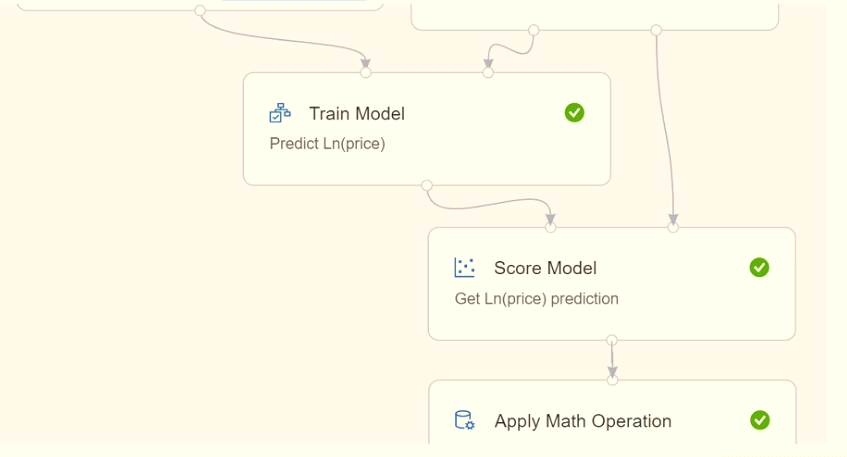
Because of non-linear relationships in the data, the pipeline calculates the natural log (Ln) of the prices in the training data, trains a model to predict this natural log of price value, and then calculates the exponential of the scored label to get the predicted price.
The training pipeline is shown in the exhibit (Click the Training pipeline tab.)
You create a real-time inference pipeline from the training pipeline, as shown in the exhibit. (Click the Real-time pipeline lab.)
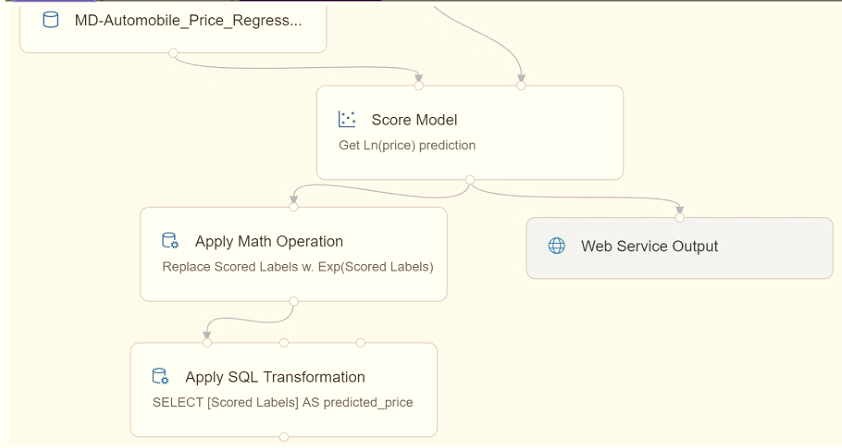
You need to modify the inference pipeline to ensure that the web service returns the exponential of the scored label as the predicted automobile price and that client applications are not required to include a price value in the input values.
Which three modifications must you make to the inference pipeline? Each correct answer presents part of the solution.
OptionsHotspot
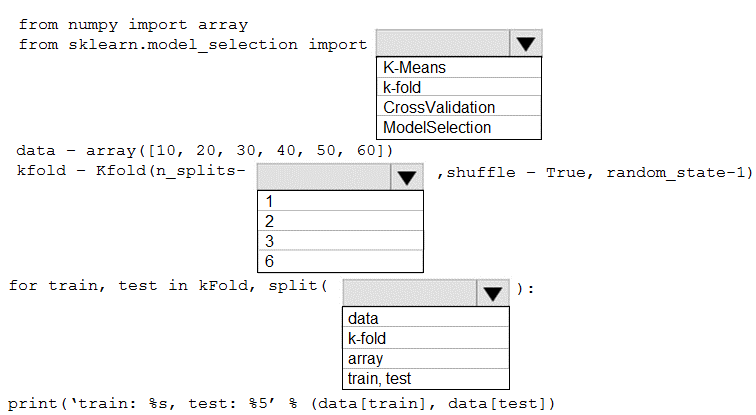
You are evaluating a Python NumPy array that contains six data points defined as follows:
data = [10, 20, 30, 40, 50, 60]
You must generate the following output by using the k-fold algorithm implantation in the Python Scikit-learn machine learning library:
train: [10 40 50 60], test: [20 30]
train: [20 30 40 60], test: [10 50]
train: [10 20 30 50], test: [40 60]
You need to implement a cross-validation to generate the output.
How should you complete the code segment? To answer, select the appropriate code segment in the dialog box in the answer area.
NOTE: Each correct selection is worth one point.
References:
Hotspot
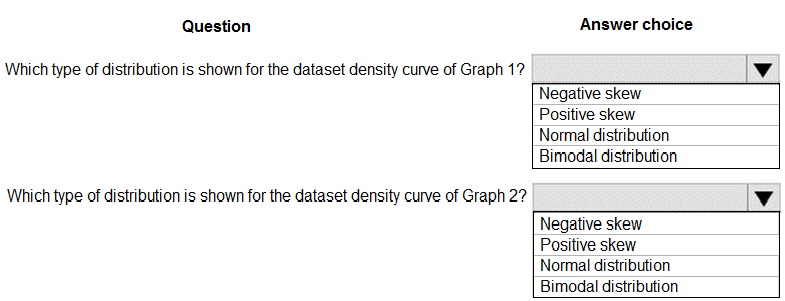
You are analyzing the asymmetry in a statistical distribution.
The following image contains two density curves that show the probability distribution of two datasets.
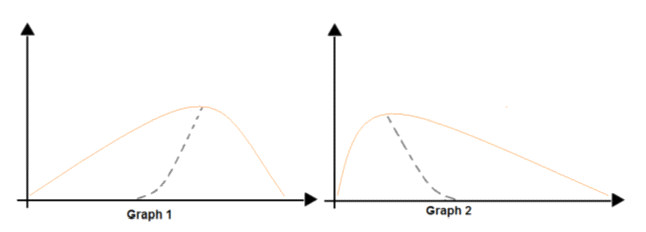
Use the drop-down menus to select the answer choice that answers each question based on the information presented in the graphic.
NOTE: Each correct selection is worth one point.
References:
Hotspot
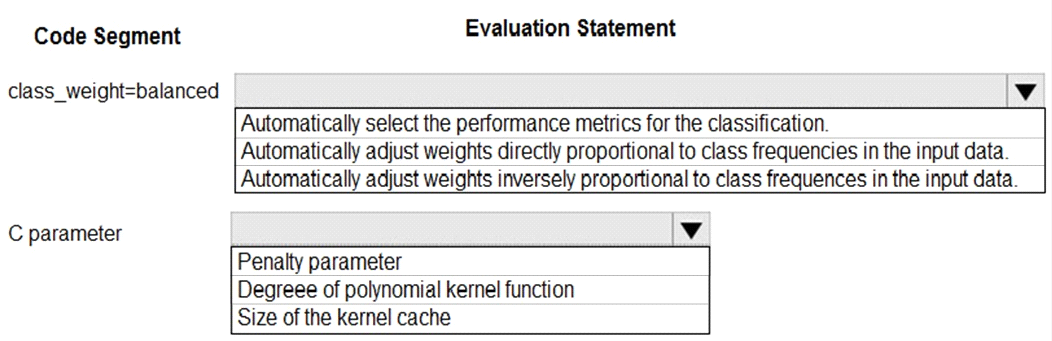
You are using C-Support Vector classification to do a multi-class classification with an unbalanced training dataset. The C-Support Vector classification using Python code shown below:
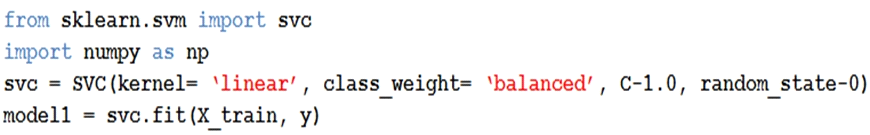
You need to evaluate the C-Support Vector classification code.
Which evaluation statement should you use? To answer, select the appropriate options in the answer area.
NOTE: Each correct selection is worth one point.
References:
Hotspot
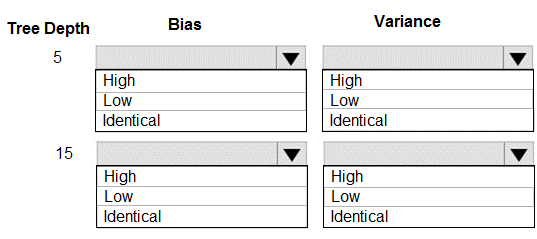
You are using a decision tree algorithm. You have trained a model that generalizes well at a tree depth equal to 10.
You need to select the bias and variance properties of the model with varying tree depth values.
Which properties should you select for each tree depth? To answer, select the appropriate options in the answer area.
References: