Deal of The Day! Hurry Up, Grab the Special Discount - Save 25% - Ends In 00:00:00 Coupon code: SAVE25
Microsoft Exam DP-500 Topic 1 Question 20 Discussion
Actual exam question for
Microsoft's
DP-500 exam
Question #: 20
Topic #: 1
[All DP-500 Questions]
Topic #: 1
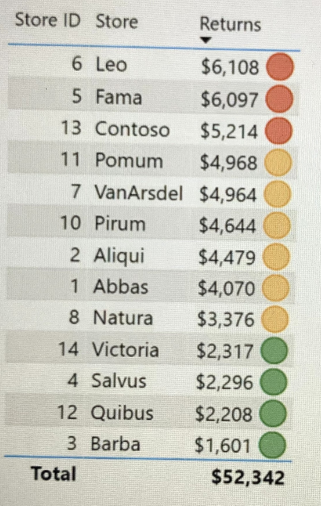
You have a Power Bl report that contains the table shown in the following exhibit.

The table contains conditional formatting that shows which stores are above, near, or below the monthly quota for returns. You need to ensure that the table is accessible to consumers of reports who have color vision deficiency. What should you do?
Suggested Answer:
A
Report accessibility checklist, All Visuals.
* Ensure alt text is added to all non-decorative visuals on the page.
* Avoid using color as the only means of conveying information. Use text or icons to supplement or replace the color.
* Check that your report page works for users with color vision deficiency.
* Etc.
Currently there are no comments in this discussion, be the first to comment!