Deal of The Day! Hurry Up, Grab the Special Discount - Save 25% - Ends In 00:00:00 Coupon code: SAVE25
Microsoft Exam DA-100 Topic 10 Question 11 Discussion
Actual exam question for
Microsoft's
DA-100 exam
Question #: 11
Topic #: 10
[All DA-100 Questions]
Topic #: 10
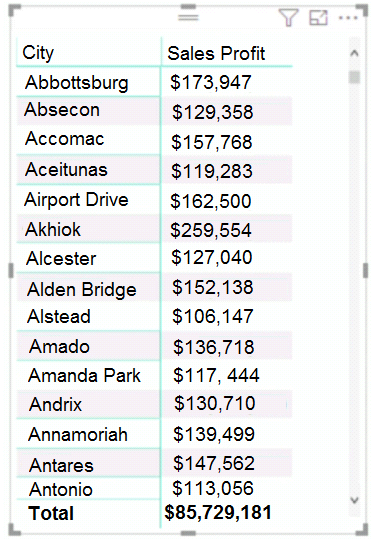
You have the dataset shown in the following exhibit.

You need to ensure that the visual shows only the 10 cities that have the highest sales profit.
What should you do?
Suggested Answer:
A
Power BI Top N Filters are useful to display the top performing records, and Bottom N filters are helpful to display the least performing records. For example, we can display top or bottom 10 products by orders or sales.
Note:
Select the Column you want to display the Top Sales Profit
Then change the Filter Type of that Column to Top N
Fill in Top / Bottom number field
And lastly drag to the By Value filed your Sales Profit
Currently there are no comments in this discussion, be the first to comment!