Free Preparation Discussions
IIBA Exam CBDA Topic 4 Question 18 Discussion
Topic #: 4
A data scientist is analyzing a dataset to determine if there is a strong relationship between two variables. A measure of covariance is done. Which of the following graphs indicate Zero Covariance between variables?
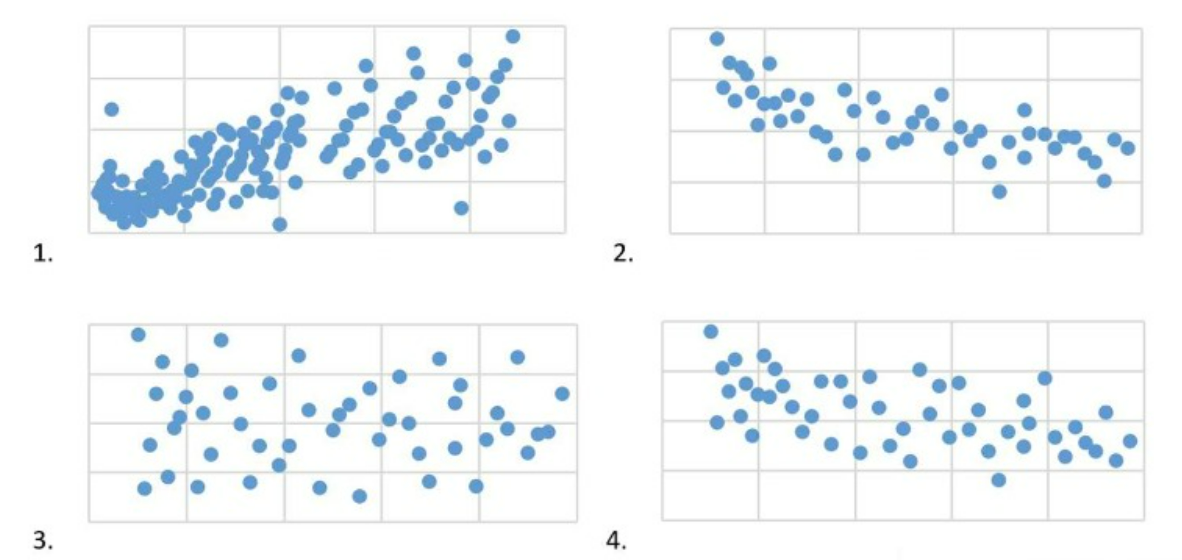
Covariance measures the directional relationship between the returns on two assets. A positive covariance means that asset returns move together while a negative covariance means they move inversely. Zero covariance indicates that the returns on the two assets move independently of each other. In the context of a scatter plot, zero covariance is represented by a plot where the points do not show any upward or downward trend but are rather scattered randomly on the graph with no discernible pattern.
Graph 4 displays such a pattern where there is no apparent relationship between the variables on the x and y axes, indicating that there is zero covariance between them.
Annita
6 months agoDella
6 months agoVerdell
7 months agoEmilio
7 months agoCaitlin
6 months agoSabine
7 months agoRyan
7 months agoNovella
7 months agoKenny
7 months agoCarol
6 months agoSarah
6 months agoSheldon
6 months agoRosio
7 months agoSol
7 months agoDorothy
7 months agoJanine
7 months agoCarlota
7 months agoJannette
6 months agoSheridan
6 months agoJunita
7 months agoMargurite
7 months ago