Deal of The Day! Hurry Up, Grab the Special Discount - Save 25% - Ends In 00:00:00 Coupon code: SAVE25
Google Exam GSuite Topic 1 Question 18 Discussion
Actual exam question for
Google's
GSuite exam
Question #: 18
Topic #: 1
[All GSuite Questions]
Topic #: 1
Overview
As the new regional sales manager at Cuppa Coffee Company, your manager has asked you to review, update, and add to two existing Google Slides presentations. In the following questions, you will be editing presentations.

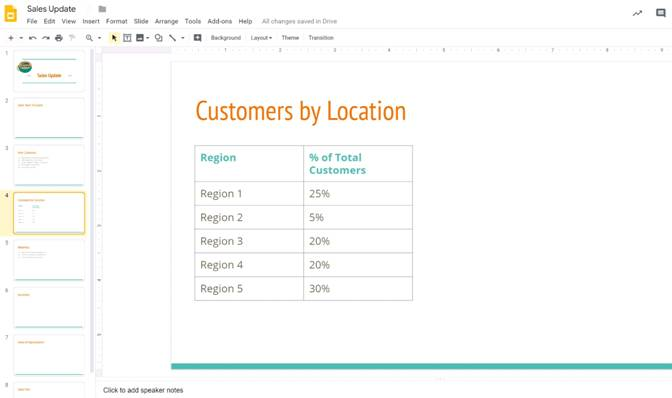
You want to show the percentage of new customers by location. Open the Sales Update presentation. On the Customers by Location slide, add a pie chart using the data below.
Data:
Region 1:25%
Region 2:5%
Region 3:20%
Region 4:20%
Region 5:30%
Suggested Answer:
A
Currently there are no comments in this discussion, be the first to comment!